บทที่ 8 การพัฒนา Dashboard ด้วย JavaScript
7.1 บทนำ
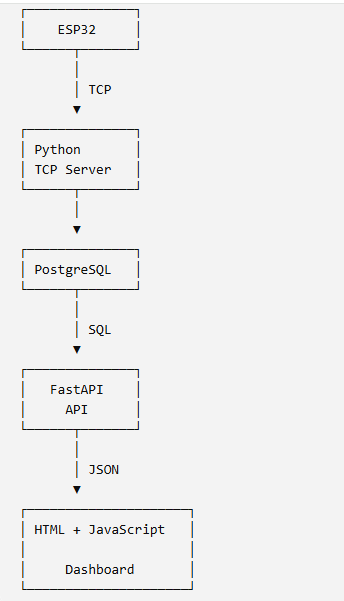
ในบทนี้ จะนำความรู้ JavaScript ที่ได้ศึกษามาแล้ว มาประยุกต์ใช้ในการพัฒนา Dashboard สำหรับระบบ IoT โดยให้ JavaScript ทำหน้าที่ติดต่อกับ Server ผ่าน HTTP/HTTPS และรับข้อมูลในรูปแบบ JSON จาก API เพื่อนำมาแสดงผลบนหน้าเว็บ
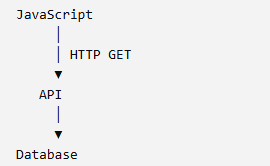
ภาพรวมของการทำงานสามารถแสดงได้ดังนี้
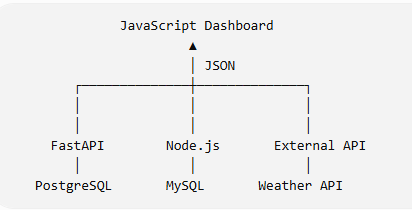
โดย JavaScript สามารถเปลี่ยนแหล่งข้อมูลได้ หรือสามารถดึงข้อมูลมาจากแหล่งข้อมูลอื่น ๆ ได้
8.2 แนวคิดของ Dashboard
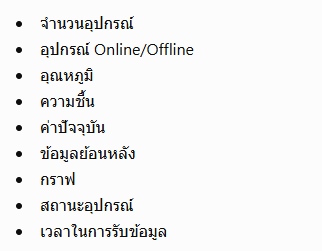
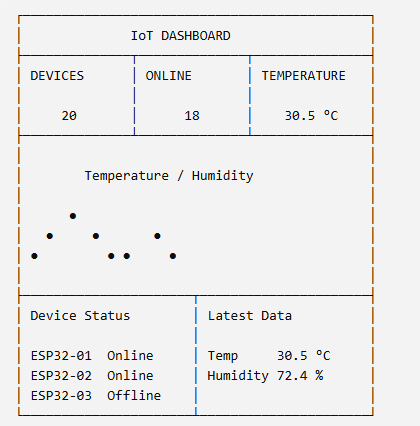
Dashboard คือหน้าจอที่นำข้อมูลจำนวนมากมาแสดงในรูปแบบที่ผู้ใช้งานสามารถเข้าใจได้อย่างรวดเร็ว สำหรับระบบ IoT สามารถแสดง
ตัวอย่าง
JavaScript ที่ทำงานอยู่บน Browser ไม่ได้ติดต่อ PostgreSQL โดยตรง แต่ติดต่อผ่าน API
GET http://127.0.0.1:8000/device
Server อาจตอบกลับ
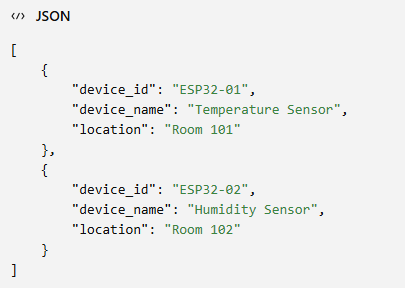
JavaScript จะนำข้อมูลดังกล่าวไปสร้าง Dashboard
การใช้ Fetch API
fetch() เป็น API ของ JavaScript สำหรับสร้าง HTTP Request ตัวอย่างการอ่านข้อมูล fetch("http://127.0.0.1:8000/device") สามารถใช้กับ HTTP Method ต่าง ๆ เช่น GET ,POST, PUT , DELETE ดังนั้นความรู้จากบทนี้สามารถนำไปใช้กับระบบ Web และ IoT ที่ใช้ REST API ได้
เมื่อ Server ส่ง JSON กลับมา จะต้องแปลง JSON เป็น JavaScript Object เช่นมีการส่งข้อมูล JSON
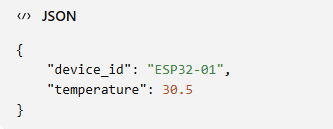
JavaScript สามารถแปลงข้อมูลด้วยคำสั่ง const data = await response.json(); จากนั้นสามารถเข้าถึงข้อมูลได้
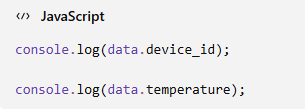
สำหรับข้อมูลหลายรายการ
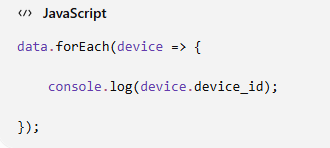
การสร้าง Dashboard ด้วย HTML และ CSS นั้น HTML ทำหน้าที่กำหนดโครงสร้าง และ CSS ทำหน้าที่จัดรูปแบบ เช่น
- ขนาด
- ตำแหน่ง
- ระยะห่าง
- ตาราง
- Card
JavaScript สามารถนำข้อมูลจาก API มาเปลี่ยนแปลงเป็น HTML เพือแสดงผลบนหน้าจอได้
การดึงข้อมูลแบบอัตโนมัติ
หลายงานที่ข้อมูลมีการเปลี่ยนแปลงตลอดเวลา จึงสามารถกำหนดให้ JavaScript เรียก API เป็นระยะได้ เช่น เช่น ทุก 5 วินาทีให้ดึงหรือขอข้อมูล API จากเซิฟเวอร์ด้วยคำสั่ง setInterval(loadData, 5000);
ตัวอย่างโปรแกรมแสดงค่าอุณภูมิและความชื้นล่าสุดของ ESP32
ให้นำโค้ดตัวอย่างการดึงค่าอุณหภูมิล่าสุดมาแสดงบน dashboard ไปสร้างเป็นไฟล์ dashboard.html
      <!DOCTYPE html>
<html lang="th">
<head>
    <meta charset="UTF-8">
    <meta name="viewport" content="width=device-width, initial-scale=1.0">
    <title>IoT Sensor Dashboard</title>
    <style>
        body {
            font-family: Arial, sans-serif;
            background: #f2f2f2;
            text-align: center;
            margin: 0;
            padding: 30px;
        }
        h1 {
            margin-bottom: 30px;
        }
        .dashboard {
            display: flex;
            justify-content: center;
            gap: 30px;
            flex-wrap: wrap;
        }
        .card {
            background: white;
            width: 250px;
            padding: 30px;
            border-radius: 15px;
            box-shadow: 0 3px 10px rgba(0,0,0,0.15);
        }
        .title {
            font-size: 20px;
            margin-bottom: 15px;
        }
        .value {
            font-size: 42px;
            font-weight: bold;
        }
        .unit {
            font-size: 20px;
        }
        #device {
            margin-top: 30px;
            font-size: 18px;
        }
        #time {
            margin-top: 10px;
            color: gray;
        }
        #status {
            margin-top: 20px;
        }
    </style>
</head>
<body>
    <h1>IoT Sensor Dashboard</h1>

    <div class="dashboard">
        <!-- Temperature -->
        <div class="card">
            <div class="title">Temperature</div>
            <div class="value">
                <span id="temperature">--</span>
                <span class="unit">°C</span>
            </div>
        </div>

        <!-- Humidity -->
        <div class="card">
            <div class="title">Humidity</div>
            <div class="value">
                <span id="humidity">--</span>
                <span class="unit">%</span>
            </div>
        </div>
    </div>

    <div id="device">Device: --</div>
    <div id="time">Last Update: --</div>
    <div id="status">กำลังเชื่อมต่อ Server...</div>

    <script>
        // ==========================================
        // อ่านข้อมูล Sensor ล่าสุด
        // ==========================================
        async function loadSensorData() {
            try {
                const response = await fetch("http://127.0.0.1:8000/sensor/latest");

                // ตรวจสอบ HTTP Status
                if (!response.ok) {
                    throw new Error("HTTP Error: " + response.status);
                }

                // แปลง JSON เป็น JavaScript Object
                const data = await response.json();

                // ==================================
                // นำข้อมูลมาแสดงบนหน้าเว็บ
                // ==================================
                document.getElementById("temperature").textContent = data.temperature;
                document.getElementById("humidity").textContent = data.humidity;
                document.getElementById("device").textContent = "Device: " + data.device_id;
                document.getElementById("time").textContent = "Last Update: " + data.timestamp;
                document.getElementById("status").textContent = "เชื่อมต่อ Server สำเร็จ";
            }
            catch (error) {
                console.error(error);
                document.getElementById("status").textContent = "ไม่สามารถเชื่อมต่อ Server ได้";
            }
        }

        // ==========================================
        // เรียกข้อมูลครั้งแรก
        // ==========================================
        loadSensorData();

        // ==========================================
        // อ่านข้อมูลใหม่ทุก 5 วินาที
        // ==========================================
        setInterval(loadSensorData, 5000);

</body>
</html>
ในส่วนของด้านเซิฟเวอร์ให้สร้างไฟล์ server_fastAPI_dashboard.py โดยใช้โค้ดดังในตัวอย่างด้านล่างนี้
 from fastapi import FastAPI
from fastapi.middleware.cors import CORSMiddleware
from pydantic import BaseModel
import psycopg

# -------------------------
# FastAPI
# -------------------------

app = FastAPI()

# -------------------------
# CORS
# -------------------------

app.add_middleware(

    CORSMiddleware,

    allow_origins=["*"],

    allow_credentials=True,

    allow_methods=["*"],

    allow_headers=["*"]

)

# -------------------------
# PostgreSQL
# -------------------------

conn = psycopg.connect(

    host="localhost",
    dbname="iot_database",
    user="postgres",
    password="***********",
    port=5432

)

print("เชื่อมต่อ PostgreSQL สำเร็จ")

# -------------------------
# JSON Model
# -------------------------

class Device(BaseModel):

    device_id: str
    device_name: str
    location: str
    ip_address: str


# ==========================================================
# POST : เพิ่มข้อมูลอุปกรณ์
# ==========================================================

@app.post("/device")
def add_device(device: Device):

    try:

        with conn.cursor() as cur:

            cur.execute(
                """
                INSERT INTO device
                (
                    device_id,
                    device_name,
                    location,
                    ip_address
                )

                VALUES
                (%s,%s,%s,%s)
                """,

                (
                    device.device_id,
                    device.device_name,
                    device.location,
                    device.ip_address
                )

            )

        conn.commit()

        print("บันทึกข้อมูลสำเร็จ")

        return {

            "status":"OK",
            "message":"บันทึกข้อมูลสำเร็จ"

        }

    except Exception as e:

        conn.rollback()

        print(e)

        return {

            "status":"ERROR",
            "message":str(e)

        }


# ==========================================================
# GET : อ่านข้อมูลทั้งหมด
# ==========================================================

@app.get("/device")
def get_device():

    try:

        with conn.cursor() as cur:

            cur.execute(
                """
                SELECT

                    device_id,
                    device_name,
                    location,
                    ip_address

                FROM device

                ORDER BY device_id
                """
            )

            rows = cur.fetchall()

        device_list = []

        for row in rows:

            device_list.append({

                "device_id": row[0],
                "device_name": row[1],
                "location": row[2],
                "ip_address": row[3]

            })

        return device_list

    except Exception as e:

        print(e)

        return {

            "status":"ERROR",
            "message":str(e)

        }


# ==========================================================
# GET : อ่านค่า Temperature และ Humidity ล่าสุด
# ==========================================================

@app.get("/sensor/latest")
def get_latest_sensor():

    try:

        with conn.cursor() as cur:

            cur.execute(
                """
                SELECT
                    data_id,
                    device_id,
                    temperature,
                    humidity,
                    recorded_at
                FROM sensor_data
                ORDER BY recorded_at DESC
                LIMIT 1
                """
            )

            row = cur.fetchone()

        if row is None:

            return {
                "status": "ERROR",
                "message": "ไม่พบข้อมูล Sensor"
            }

        return {

            "data_id": row[0],

            "device_id": row[1],

            "temperature": float(row[2]),

            "humidity": float(row[3]),

            "recorded_at": row[4]

        }

    except Exception as e:

        print("Database Error:", e)

        return {

            "status": "ERROR",

            "message": str(e)

        }
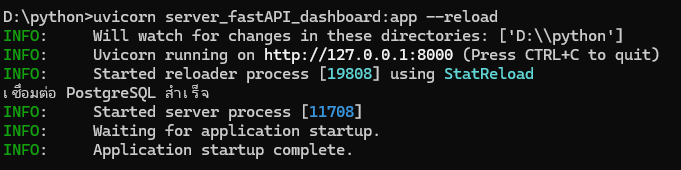
ทำการรันไฟล์ server_fastAPI_dashboard บนเซอร์เวอร์ ด้วยคำสั่ง uvicorn server_fastAPI_dashboard:app --reload
จะปรากฏหน้าต่างบนเซอร์เวอร์ดังรูป
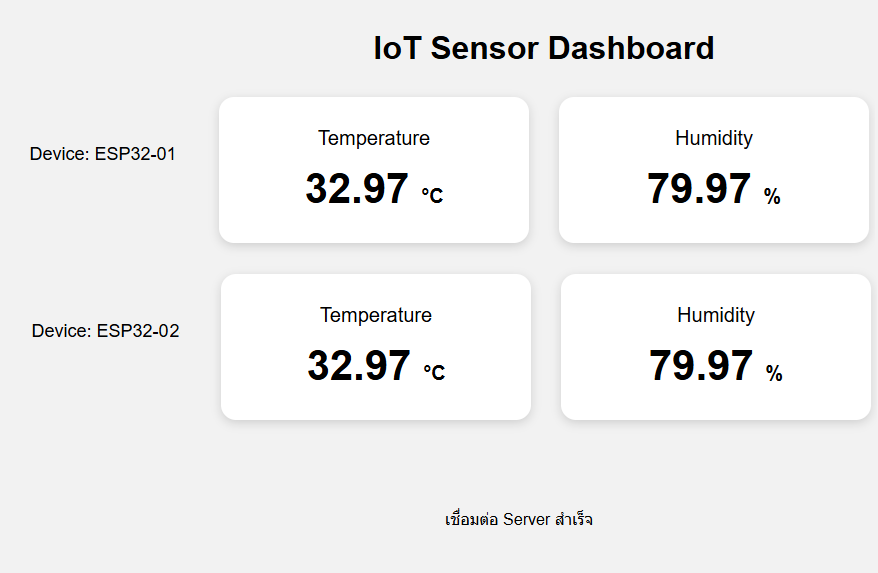
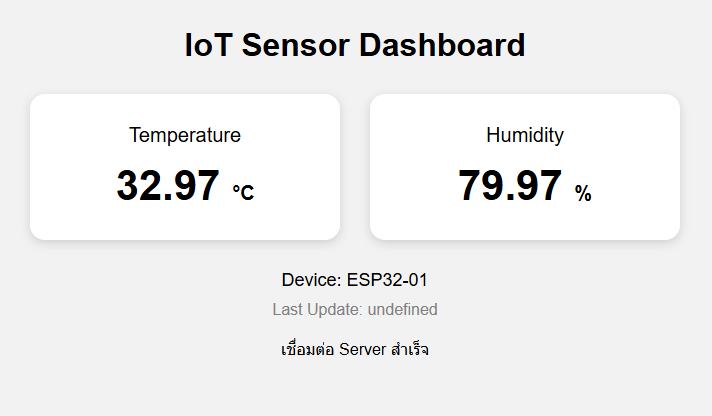
จากนั้นเปิดไฟล์โปรแกรมฝั่ง Client ชื่อไฟล์ dashboard.html จะเห็นค่าของอุณหภูมิและความชื้นล่าสุดของตารางจากฐานข้อมูลแสดงบนหน้าต่างดังรูป
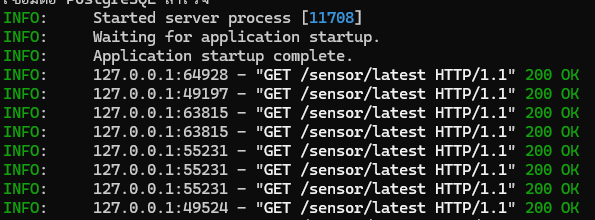
และฝั่ง Server จะปรากฏการแสดงการร้องขอมาจาก client และการสื่อสารที่สมบูรณ์ ดังแสดงในรูป
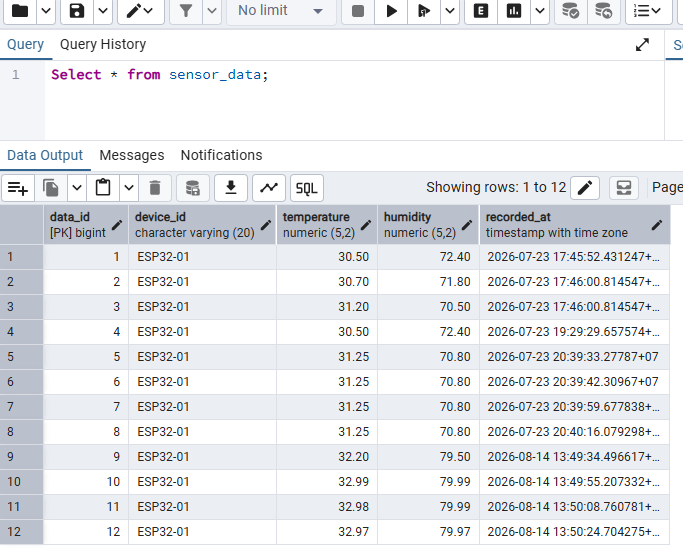
ซึ่งหากเปิดตาราง sensor_data ของฐานข้อมูล ก็จะเห็นค่าข้อมูลล่าสุดในตารางดังรูป
ให้นำ ESP32 มาประยุกต์ใช้ในการพัฒนาให้อ่านค่าอุณหภูมิและความชื้น ส่งค่ามาเก็บไว้ในตาราง sensor_data ทุก ๆ 5 วินาที เพื่อใช้สำหรับการนำไปใช้แสดงกราฟในการทดลองหัวข้อต่อไป โดยอ้างอิงงานมอบหมายในบทที่ 5
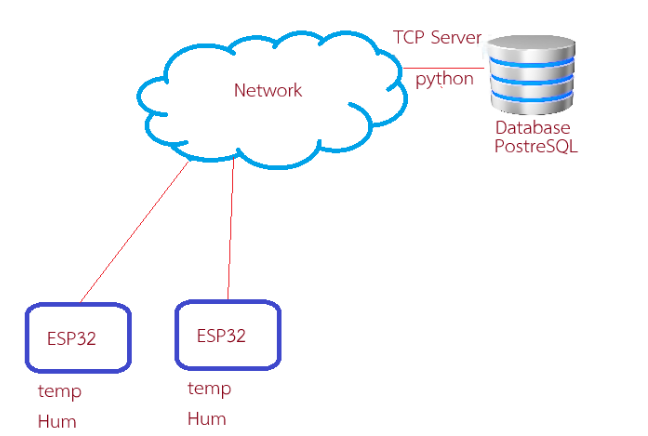
ให้สร้าง dashboard เพื่อแสดงค่าข้อมูลล่าสุดของ ESP32-02 ตัวที่ 2 ดังลักษณะในรูป